Applied Time Series Analysis and Forecasting with R Projects

This course is the perfect opportunity to learn and practice time series analysis and forecasting with R. With the help of 3 distinct projects, you will learn how to work with trending data, model seasonal datasets, and connect R to Yahoo Finance to scrape stock data. You will also learn how to create standard and ggplot2 time series visualizations, compare models with time series cross validation, and impute missing data. With the help of this course, you will be able to check which weekday is the best for buying and selling stocks. With the 30 days money back guarantee, lifetime access, instructor support, and a certificate for your CV, this course is the perfect way to learn and practice time series analysis and forecasting with R.▼
Course Feature
![]() Cost:
Cost:
Paid
![]() Provider:
Provider:
Udemy
![]() Certificate:
Certificate:
Paid Certification
![]() Language:
Language:
English
![]() Start Date:
Start Date:
2018-07-10
Course Overview
❗The content presented here is sourced directly from Udemy platform. For comprehensive course details, including enrollment information, simply click on the 'Go to class' link on our website.
Updated in [July 25th, 2023]
This course provides an opportunity to learn and practice R for time series analysis and forecasting. R is the leading open source software for this purpose, offering functions and features that are not available in other tools, such as exponential smoothing, ARIMA models, time series cross validation, missing data handling, visualizations and forecasts.
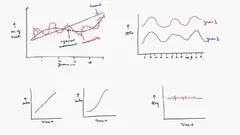
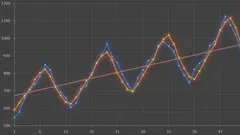
The course is structured with three distinct projects. The first project focuses on trending data, and as a secondary topic, students will learn how to create standard and ggplot2 time series visualizations. The dataset for this project will be an employment rate dataset. The second project uses German monthly inflation rates over the last 10 years to demonstrate how to model seasonal datasets, and compares the models with time series cross validation. The third project connects R to yahoo finance and scrapes stock data. The resulting data requires pre-processing and cleaning, including missing data imputation. Students will then check which weekday is the best for buying and selling the Novartis stock.
Some knowledge of R is required to follow along. There is an introduction to time series analysis and forecasting course available, which is more of a step by step guide, while this course is applied and project based. Both courses can be taken on their own, or students can take a look at both and learn the subject from two different angles.
The course script is provided as a text file, and students will also receive the standard Udemy benefits, such as a 30-day money back guarantee, lifetime access, instructor support and a certificate for their CV.
Course Provider