Creating a Power BI Report - Detailed Power BI Tutorial

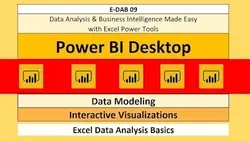
This tutorial provides a detailed guide to creating a Power BI report. It covers adding a report title, navigation buttons with bookmarks, card visualizations and filtering, line charts, stacked column charts, treemaps, and more. It is a comprehensive guide to creating a powerful and informative report.▼
Course Feature
![]() Cost:
Cost:
Free
![]() Provider:
Provider:
Youtube
![]() Certificate:
Certificate:
Paid Certification
![]() Language:
Language:
English
![]() Start Date:
Start Date:
On-Demand
Course Overview
❗The content presented here is sourced directly from Youtube platform. For comprehensive course details, including enrollment information, simply click on the 'Go to class' link on our website.
Updated in [February 21st, 2023]
Creating a Power BI Report - Detailed Power BI Tutorial
This course provides a detailed tutorial on how to create a Power BI report. It covers topics such as adding a report title, adding navigation buttons with bookmarks, card visualizations and filtering, line charts, stacked column chart, and treemap.
Learners of this course can develop their career paths in data analysis, business intelligence, and data visualization. They can also pursue further education in related fields such as computer science, data science, and analytics.
Learning suggestions for learners include exploring other Power BI features such as creating dashboards, using slicers, and creating visuals. They can also explore other data visualization tools such as Tableau and Excel. Additionally, they can learn more about data analysis and data science to gain a better understanding of the data they are working with.
Course Provider