54 Related Courses
Data Analysis in Excel
This course provides an introduction to data analysis in Excel. It covers the data analysis process, a framework to help transform raw data into useful information for decision-making. Learners will also explore a variety of functions to prepare text and date fields, as well as the VLOOKUP function to insert data from another table. Finally, learners will use a variety of functions to analyse Kickstarter data and gain insight into the characteristics of successful projects. This course is ideal for anyone looking to gain a better understanding of data analysis in Excel.
Time Series with datatable in R
This course is perfect for anyone looking to master time series data using data.table in R. With its expressive syntax and support for in-place operations, data.table is the perfect tool to build reliable data processing pipelines. Learn how to use data.table to make your code powerful, readable, and fast. Sign up now and master time series data in data.table!
Object Oriented Programming in Python
Python's object-oriented programming (OOP) allows developers to create complex, data-driven applications. OOP differs from procedural programming by allowing developers to define their own classes and methods, and to inherit from existing classes. With OOP, developers can create customised methods, attributes, and constructors, as well as define class-level and instance-level data. Additionally, OOP allows developers to ensure that objects that store the same data are treated equally, and to customise object string representations and create new error types. Finally, developers can further customise their classes to behave more like standard Python data types.
Manipulating Time Series Data with xts and zoo in R
This course is perfect for anyone who wants to learn how to manage and manipulate time series data in R. With the help of the xts and zoo packages, you will be able to quickly and accurately analyze time series data. You will learn the basics of xts and zoo, as well as advanced tips and tricks for working with time series data in R. Sign up now and start mastering time series data with xts and zoo in R!
Image Processing with Keras in Python
Keras is a powerful library for image processing in Python. This tutorial introduces students to convolutions and how to use them on image data. It also covers how to incorporate convolutions into Keras neural networks, build deep networks by stacking multiple convolutional layers, and track and control the number of parameters as the network grows. Finally, it focuses on our ability to track how well a network is performing and investigate methods for improving convolutional neural networks.

Introduction to Git
Explore the essentials of Introduction to Git
Visualizing Geospatial Data in Python
Learn how to visualize geospatial data in Python! This course will teach you how to make a two-layer map by first plotting regions from a shapefile and then scatterploting location points. You'll also learn about projections and coordinate reference systems, and practise joining data spatially. Plus, you'll use three different GeoSeries attributes and methods to obtain information about the geometries in your data. You'll also use folium to create a street map layer and discover a choropleth, a type of map. Finally, you'll learn and practise choropleth construction using two different packages: geopandas and folium.
Intermediate SQL Queries
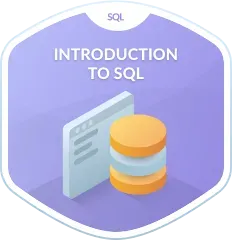
Get a comprehensive overview of Intermediate SQL Queries
Machine Learning for Everyone
Discover the power of SQL with "Machine Learning for Everyone." Dive into a captivating case study of an online movie rental company, exploring a database filled with customer information, movie ratings, actor backgrounds, and more. Unlock the ability to make data-driven decisions as you learn to harness the potential of SQL queries. Investigate customer preferences, analyze customer engagement, and uncover sales development opportunities. Gain an edge with SQL extensions for online analytical processing (OLAP), simplifying the extraction of crucial insights from multidimensional aggregated data. Take your data analysis skills to new heights and equip yourself with the tools to thrive in the world of machine learning.
Introduction to Portfolio Risk Management in Python
Portfolio risk management is an important part of investing. With Python, you can learn the fundamentals of investment risk and the distribution of financial returns. You'll also learn about the main factors influencing portfolio returns and how to quantify your portfolio's exposure to these factors. Finally, you'll learn two methods for estimating the likelihood of sustaining losses and the expected values of those losses for a given asset or portfolio of assets. Get started with portfolio risk management in Python today!
Introduction to Version Control with Git
Learn the power of version control with Git! This course is an introduction to version control with Git specifically designed for data scientists. Get up to speed quickly and learn how to use Git to get more done in less time and with less pain. Unlock the power of version control and take your data science projects to the next level.

Intro to Computational Finance with R
This online course, Intro to Computational Finance with R, is perfect for anyone looking to gain a better understanding of financial data. You'll learn how to use R to analyze financial data, estimate statistical models, and construct optimized portfolios. With this course, you'll be able to make informed decisions and maximize your financial success.
Intermediate Python for Finance
This intermediate Python for Finance course will teach you how to use Python to analyse financial data. Learn how to create and manipulate Python datetime objects, use dictionaries to store and look up items, use Boolean logic to determine truth, control execution in if-statements and loops, and use pandas to create and access DataFrames. Discover how to interpret new data, create masks to filter data, and use plots to visualise your findings. Take your financial analysis skills to the next level with this comprehensive course.
Foundations of Probability in Python
Python is a great language for learning the foundations of probability. In this course, you'll learn about basic probability concepts such as random variables, mean and variance, probability distributions, and conditional probability. You'll also investigate two crucial probability results: the law of large numbers and the central limit theorem. Finally, you'll explore three more binomial-related distributions: the normal, Poisson, and geometric distributions. Plus, you'll investigate the relationships between linear and logistic regressions as probability and statistics applications in data science.
AI Fundamentals
No programming experience required! This course provides a comprehensive introduction to AI fundamentals, covering topics such as machine learning, natural language processing, and more.
Cluster Analysis in Python
Clustering is a popular unsupervised learning algorithm used to group data points into clusters. In this article, we will explore two common clustering techniques: hierarchical clustering and k-means clustering. We will also introduce a new clustering algorithm, k-means clustering, and its SciPy implementation. Finally, we will discuss the process of determining dominant colours in an image before moving on to the problem discussed in the introduction - news article clustering.
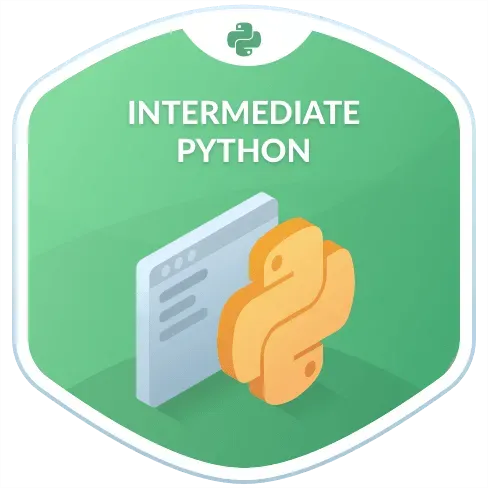
Intermediate Python
This course provides an intermediate level of instruction in Python programming. Students will learn to create visualizations using Matplotlib and manipulate DataFrames with pandas. By the end of the course, students will have a better understanding of Python and its applications in data science.
Dimensionality Reduction in Python
Dimensionality reduction is a powerful tool for data exploration and pre-processing. Learn the distinction between feature selection and feature extraction, and how to use both techniques to overcome the curse of dimensionality. Discover how to detect and remove features that add little value to the dataset, and use models to find the most important features for predicting a target feature. Gain an understanding of why this algorithm is so powerful and use it for data exploration and pre-processing.
Intermediate Regression with statsmodels in Python
Learn how to use statsmodels to extend your linear regression knowledge to parallel slopes regression, and investigate the impact of explanatory variable interactions. With this powerful tool, you can easily work with variables that have more than two explanatory variables, and expand your logistic regression knowledge to include multiple explanatory variables. Plus, gain an understanding of logistic distribution, which is essential for implementing your own logistic regression algorithm.
PostgreSQL Summary Stats and Window Functions
Explore the essentials of PostgreSQL Summary Stats and Window Functions
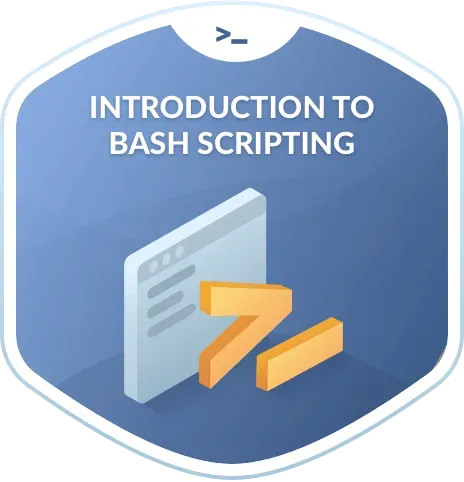
Introduction to Bash Scripting
This course is perfect for anyone looking to learn the basics of Bash scripting. You'll learn how to build analytics pipelines in the cloud and work with data stored across multiple files. You'll be guided through the fundamentals of Bash script structures, data structures, control statements, and more. You'll also create your own Bash functions and schedule automated scripts to run with cron. Get started today and become a Bash scripting expert!
Regular Expressions in Python
Learn how to master basic string manipulation operations and understand the fundamental concepts of regular expression syntax using a movie review dataset. Explore the benefits and drawbacks of positional formatting, embedding expressing inside string constants, and using the Template class. Discover how to use pattern matching with regular and special characters, as well as greedy and lazy quantifiers. Plus, learn more advanced pattern matching techniques such as using parentheses to group strings together or to match the same text as matched previously.
Foundations of Inference in R
Foundations of Inference in R is an online course that teaches you how to use the R programming language to draw conclusions about a population from a sample of data. Learn the fundamentals of statistical inference and gain the skills to make informed decisions about your data.
Introduction to MongoDB in Python
This course introduces you to MongoDB in Python. Learn how to use the MongoDB language to search and analyze data, and explore data structures as you see fit. With MongoDB, you can store and process data without adhering to the strict relational format of SQL. In this course, you will explore and answer questions about Nobel Laureates and prizes using unprocessed data from the official nobelprize.org API. Take this course to gain the skills you need to work with MongoDB in Python.
Writing Functions in Python
Python functions are a powerful tool for writing code that is easy to read, maintain, and debug. In this article, we'll cover docstrings and why they are important, as well as how to tell when a chunk of code needs to be turned into a function. We'll also look at how Python passes arguments to functions in detail, as well as some common pitfalls that can cause debugging headaches when calling functions. We'll also understand decorators (functions as objects, scope, and closures), and will give you a good overview of how decorators are used and defined. To help you understand how decorators work under the hood, this chapter provides a slew of real-world examples of when and how you might use decorators in your own code. Finally, we'll learn advanced decorator concepts such as how to keep the metadata of your decorated functions and how to write decorators that take arguments.
Linear Classifiers in Python
Python is a great language for machine learning, and linear classifiers are a great way to get started. Logistic regression and support vector machines (SVMs) are two of the most popular linear classifiers used in Python. In this course, you'll learn the fundamentals of using these models to solve classification problems. You'll gain an understanding of the conceptual framework that underpins logistic regression and SVMs, and learn about logistic regression in depth. You'll also learn everything there is to know about support vector machines, including tuning hyperparameters and using kernels to fit non-linear decision boundaries.
Supply Chain Analytics in Python
Python is a powerful tool for supply chain analytics. With the PuLP framework, users can easily model linear programming (LP) and integer programming (IP) problems. PuLP can also be used to solve large-scale problems, making it an ideal choice for supply chain analytics. This course covers the fundamentals of LP problems and how to use PuLP to solve them. With this knowledge, users can quickly and efficiently analyze their supply chain data.
Building Data Engineering Pipelines in Python
Learn how to use PySpark to build data engineering pipelines in Python. Discover how to ingest data from a RESTful API into a data lake, and how to write unit tests for data transformation pipelines. Explore Apache Airflow and learn how to trigger components of an ETL pipeline on a time schedule. Build robust and reusable components with this comprehensive course.
Importing and Managing Financial Data in Python
Learn how to import and manage financial data in Python with this comprehensive course! Get hands-on experience with pandas DataReader, data grouping, summarising, and visualising. Explore metrics, categorise data, compare company statistics, analyse global income distribution, and create statistical charts. Take your financial data analysis skills to the next level!

Reading Data into R with readr
This online course, Reading Data into R with readr, will teach you the features of Hadley Wickham's readr package. You'll learn how to import and export data sets, as well as more advanced topics like type conversion. With this course, you'll be able to read data into R with confidence and ease.
ARIMA Models in Python
Learn how to use ARIMA models in Python to analyze time series data. Understand the importance of stationarity in ARMA models, how to check for stationarity visually and using a standard statistical test, and how to fit ARMA, ARIMA, and ARMAX models using the statsmodels package. Discover a framework for organizing time series projects and learn how to fit more complex data with seasonal ARIMA models. Finally, decompose data into seasonal and non-seasonal components and apply ARIMA tools to a global forecast challenge.
GARCH Models in Python
GARCH models are a powerful tool for forecasting volatility in financial markets. With Python, you can create more realistic models with rolling window approaches and more sophisticated forecasts. This article introduces you to the data science modelling KISS principle, p-values and t-statistics for model configuration, ACF plots and the Ljung-Box test for validating assumptions, and likelihood and information criteria for model selection. You'll also learn how to apply GARCH models to real-world financial scenarios, such as VaR in risk management, dynamic covariance in asset allocation, and dynamic Beta in portfolio management. Discover how to create better GARCH models with Python today!
Unsupervised Learning in Python
Unsupervised learning in Python is a great way to discover underlying groups in a dataset. Learn how to cluster companies based on stock market prices and distinguish different species using measurement clustering. Also, explore hierarchical clustering and t-SNE, two unsupervised learning techniques for data visualisation. Finally, discover Principal Component Analysis (PCA), a dimension reduction technique used to improve model performance and generalisation, and Non-negative matrix factorization (NMF), a technique that expresses samples as combinations of interpretable parts.
Introduction to Spark SQL in Python
Spark SQL is a powerful tool for data analysis in Python. In this tutorial, you'll learn how to create and query a SQL table in Spark, and how to use SQL window functions to make your queries more expressive. You'll also discover how to properly cache dataframes and SQL tables, and how to use the Spark UI and query execution plan to evaluate your application and tune query performance. With Spark SQL, you can unlock the power of SQL to analyze your data.
Machine Learning for Time Series Data in Python
Machine learning and time series data are two powerful tools that can be used together to gain insights into data. This article introduces the fundamentals of machine learning, time series data, and the intersection of the two. It covers the most common features extracted from time series in order to perform machine learning, as well as best practices for using predictive modelling with time series data. Additionally, it covers the fundamentals of generating predictions with models and validating them against "test" data. With this knowledge, you can gain insights into your data before fitting your model.
Feature Engineering for NLP in Python
Learn how to use Python for feature engineering in Natural Language Processing (NLP)! This course will teach you how to compute basic features such as the number of words, characters, average word length, and special characters (such as Twitter hashtags and mentions). You'll also learn how to compute readability scores and calculate the amount of education needed to understand a piece of text. Additionally, you'll discover the concepts of tokenization and lemmatization, and learn how to use the spaCy library to perform text cleaning, part-of-speech tagging, and named entity recognition. You'll also learn about n-gram modelling and how to use it to analyse sentiment in movie reviews. Finally, you'll discover how to compute the tf-idf weights and the cosine similarity score between two vectors, as well as learn about word embeddings and compute similarities between various Pink Floyd songs using word vector representations.
Introduction to Data Science in Python
Data Science in Python is an exciting way to learn the fundamentals of Python syntax, load your first Python modules, and use functions to generate a suspect list for Bayes, DataCamp's prize-winning Golden Retriever. With this course, you will gain access to a powerful Python library: pandas. Pandas is capable of reading, modifying, and searching tabular datasets (like spreadsheets and database tables). Additionally, you will use matplotlib to generate line plots to analyse the letter frequencies from the ransom note and several handwriting samples in order to identify the kidnapper. Finally, you will discover how to make three new types of plots: scatter plots, bar plots, and histograms.
Preprocessing for Machine Learning in Python
Preprocessing data is essential for successful machine learning in Python. Learn how to explore data types, deal with missing data, and generate new features. Discover how to encode, aggregate, and extract data from numerical and textual features. Finally, use principal component analysis to reduce the number of features in your dataset. Get started now!
Introduction to Python for Finance
Python is a powerful programming language that is widely used in finance. This article provides an introduction to the basics of Python, including how to name variables and different data types. It also introduces Python lists and how to use them to work with data. Additionally, the NumPy package is introduced, which can be used to efficiently manipulate arrays. Finally, Matplotlib, a package for creating line plots, scatter plots, and histograms, is introduced. With this knowledge, you can begin to explore the world of finance with Python.
Visualizing Time Series Data in Python
Python is a powerful tool for visualizing time series data. With its basic plotting tools, you can easily annotate and personalize your time series plots. You can also take any static dataset and generate compelling data plots. By computing summary statistics and plotting aggregated views of your data, you can gain a better understanding of your time series data. Additionally, you can learn how to detect seasonality, trend, and noise in time series data automatically. Finally, you can learn how to plot multiple time series at the same time and discover and describe relationships between multiple time series.
Machine Learning for Marketing in Python
Machine learning is revolutionizing the way marketers use data to make decisions. In this course, you'll explore the fundamentals of machine learning methods used in marketing. You'll learn about various types of machine learning, data preparation steps, and will run several end-to-end models to understand their power. You'll learn the fundamentals of churn prediction, then fit logistic regression and decision tree models to predict churn. Examine the results to gain insight into what is causing the churn. You'll also learn the fundamentals of Customer Lifetime Value (CLV) and the various methods for calculating it. Finally, you'll investigate two distinct models that provide insights into customer purchasing patterns and group them into distinct and interpretable customer segments. All of this will be done using Python.
Developing Python Packages
Learn how to develop Python packages with this comprehensive guide! You'll learn how to deal with dependencies, write READMEs, include licences, use pytest, tox, flake8, cookiecutter, Makefiles, and more. Publish your package on PyPI and attract users and contributors.
Introduction to Predictive Analytics in Python
Learn the fundamentals of predictive analytics in Python with this comprehensive guide. Discover how to use logistic regression to predict a binary target with continuous variables, and how to interpret and apply this model to make predictions for new examples. Understand why variable selection is critical for developing a useful model, and how to use forward stepwise variable selection in logistic regression. Also, learn how to build and interpret the cumulative gains curve and lift graph, and use predictor insight graphs to explain the relationship between model variables and the target.
Bayesian Data Analysis in Python
Learn how to use Bayesian data analysis in Python! This course introduces the fundamental concepts of probability and statistical distributions, as well as the famous Bayes' Theorem. You'll create your first Bayesian model to draw conclusions from randomised coin tosses. You'll also learn how to use Bayes' Theorem to estimate the parameters of probability distributions using the grid approximation technique, and how to update these estimates as new data becomes available. Finally, you'll practise the important skill of reporting results to a non-technical audience, and learn how to incorporate prior knowledge into the model.
Cleaning Data with PySpark
PySpark is a powerful tool for cleaning and processing complex real-world data. In this article, we'll review the fundamentals of DataFrame and the importance of data cleaning. We'll also look at different methods for modifying the contents of DataFrames in Spark, and how to increase the efficiency of data cleaning tasks by increasing performance or lowering resource requirements. With PySpark, you can easily clean and process data to get the most out of it.
Machine Learning for Finance in Python
Machine learning is becoming increasingly popular in the finance industry. This course will teach you how to apply machine learning to financial data. You'll learn how to prepare data for use by machine learning algorithms, and how to use tree-based models to forecast stock price movements. You'll also learn how to use forest-based methods for regression and feature selection, and how to normalise and scale data before using it in KNN and neural network methods. Finally, you'll learn how to use KNN and neural network regression to forecast a stock's price in the future, as well as how to plot and find optimal stock portfolios using modern portfolio theory (MPT) and the Sharpe ratio.
Sentiment Analysis in Python
Sentiment Analysis in Python is a great way to learn the fundamentals of sentiment analysis. With real-world datasets such as tweets, movie reviews, and product ratings, you can explore the sentiment of movie reviews and use Python's nltk and scikit-learn packages to complete a sentiment analysis task from start to finish. Learn how US airline passengers expressed their feelings on Twitter and gain the skills to complete a sentiment analysis task.
Introduction to Linear Modeling in Python
Linear modeling is a powerful tool for predicting outcomes in Python. It focuses on the parameters slope and intercept, which define the model, and how to interpret them in a variety of applications. We explore common prediction flaws and limitations, and evaluate and compare models by quantifying and contrasting measures of goodness-of-fit, such as RMSE and R-squared. Additionally, we introduce inferential statistics concepts and apply them to investigate how maximum likelihood estimation and bootstrap resampling can be used to estimate linear model parameters.
Unit Testing for Data Science in Python
This course teaches you how to write effective unit tests for data science projects in Python. Learn how to structure your test suite, execute any subset of tests with ease, and flag problematic tests. Discover how to write sanity tests for data science models and matplotlib plots. Strike a balance between writing too many and too few tests with Test Driven Development (TDD). Master the art of unit testing and ensure your data science projects are reliable and bug-free.
Recurrent Neural Networks for Language Modeling in Python
Discover the fundamentals of Recurrent Neural Networks (RNN) and how to implement them with Keras in Python. Understand how information flows through the network and learn about the vanishing and exploding gradient problems that frequently occur in RNNs. Also, learn how to deal with them using GRU and LSTM cells. Understand how to prepare data for the multi-class classification task, as well as the distinctions between multi-class and binary classification (sentiment analysis). Finally, learn how to use Keras to create models and evaluate their performance, as well as how to convert text data into the format required by the models.


