D3 JS - Build Data Driven Visualizations with Javascript

This course is perfect for anyone looking to create visually appealing data-driven visualizations with JavaScript. With D3.js, a powerful JavaScript library, you can take raw data and turn it into stunning, interactive graphs and charts. Learn how to use D3.js to create dynamic, data-driven visualizations that will help you better understand and analyze your data. Take this course and become a data visualization expert!▼
Course Feature
![]() Cost:
Cost:
Free
![]() Provider:
Provider:
Youtube
![]() Certificate:
Certificate:
No Information
![]() Language:
Language:
English
![]() Start Date:
Start Date:
Self Paced
Course Overview
❗The content presented here is sourced directly from Youtube platform. For comprehensive course details, including enrollment information, simply click on the 'Go to class' link on our website.
Updated in [July 27th, 2023]
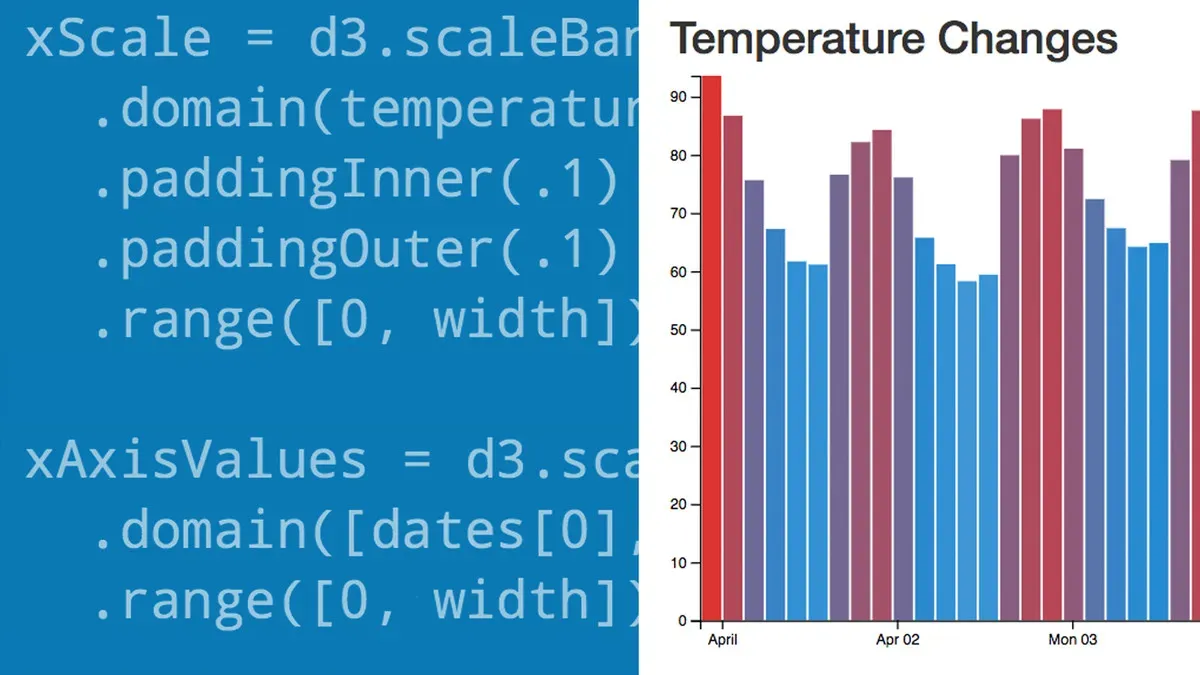
This course introduces students to D3.js, a powerful JavaScript library for creating data-driven visualizations. Students will learn how to take raw data and create visually appealing graphs and data-driven visualizations. Through hands-on activities, students will gain an understanding of the fundamentals of D3.js and how to use it to create dynamic and interactive visualizations. By the end of the course, students will have the skills to create their own data-driven visualizations.
Course Provider