Excel: Tracking Data Easily and Efficiently Online Class

This online class provides an in-depth look at how to use Excel to track data efficiently and effectively. Learn how to create a powerful spreadsheet to monitor sales, inventory, and household spending.▼
Course Feature
![]() Cost:
Cost:
Free Trial
![]() Provider:
Provider:
LinkedIn Learning
![]() Certificate:
Certificate:
No Information
![]() Language:
Language:
English
![]() Start Date:
Start Date:
Self Paced
Course Overview
❗The content presented here is sourced directly from LinkedIn Learning platform. For comprehensive course details, including enrollment information, simply click on the 'Go to class' link on our website.
Updated in [March 01st, 2023]
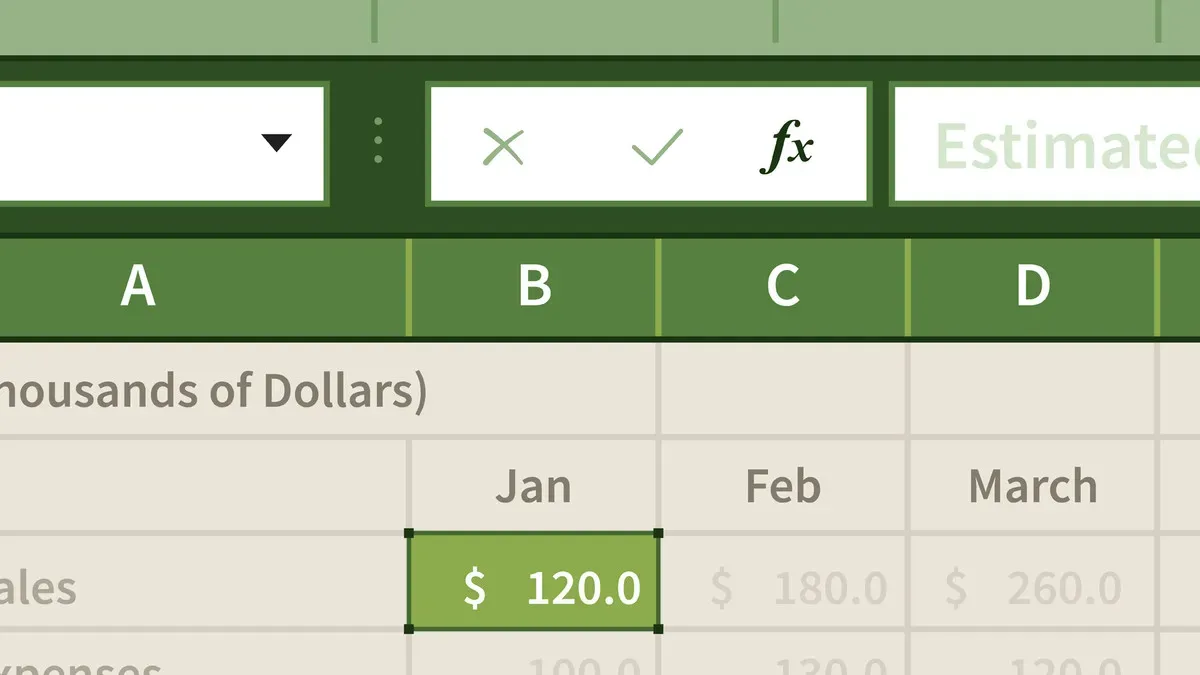
This Excel: Tracking Data Easily and Efficiently Online Class provides an overview of how to use Excel to track data. Participants will learn how to plan their data tracker, add calculations and graphics, protect cells and sheets, hide sheets, set up alerts with conditional formatting, merge data, categorize data, format their tracker, and put it all together. By the end of the class, participants will have a better understanding of how to use Excel to track data efficiently and effectively.
[Applications]
After taking this Excel: Tracking Data Easily and Efficiently Online Class, participants can apply the knowledge they have gained to create their own data trackers. They can use the skills they have learned to plan their data tracker, add calculations and graphics, protect cells and sheets, hide sheets, set up alerts with conditional formatting, merge data, categorize data, and format their tracker. With these skills, participants can create a comprehensive data tracker that meets their individual needs.
[Career Paths]
1. Data Analyst: Data Analysts are responsible for collecting, organizing, and analyzing data to help inform business decisions. They use a variety of tools, such as Excel, to track and analyze data. With the skills learned in this course, Data Analysts can easily and efficiently track data, add calculations and graphics, protect cells and sheets, hide sheets, set up alerts with conditional formatting, merge data, categorize data, and format their trackers. The demand for Data Analysts is growing rapidly, as businesses increasingly rely on data-driven decisions.
2. Business Intelligence Analyst: Business Intelligence Analysts use data to help businesses make better decisions. They use Excel to track and analyze data, as well as to create reports and dashboards. With the skills learned in this course, Business Intelligence Analysts can easily and efficiently track data, add calculations and graphics, protect cells and sheets, hide sheets, set up alerts with conditional formatting, merge data, categorize data, and format their trackers. The demand for Business Intelligence Analysts is growing rapidly, as businesses increasingly rely on data-driven decisions.
3. Data Scientist: Data Scientists use data to solve complex problems and develop new insights. They use Excel to track and analyze data, as well as to create reports and dashboards. With the skills learned in this course, Data Scientists can easily and efficiently track data, add calculations and graphics, protect cells and sheets, hide sheets, set up alerts with conditional formatting, merge data, categorize data, and format their trackers. The demand for Data Scientists is growing rapidly, as businesses increasingly rely on data-driven decisions.
4. Data Visualization Specialist: Data Visualization Specialists use data to create visual representations of data. They use Excel to track and analyze data, as well as to create reports and dashboards. With the skills learned in this course, Data Visualization Specialists can easily and efficiently track data, add calculations and graphics, protect cells and sheets, hide sheets, set up alerts with conditional formatting, merge data, categorize data, and format their trackers. The demand for Data Visualization Specialists is growing rapidly, as businesses increasingly rely on data-driven decisions.
[Education Paths]
1. Bachelor of Science in Computer Science: This degree path focuses on the fundamentals of computer science, such as programming, software engineering, and computer architecture. It also covers topics such as artificial intelligence, data structures, and algorithms. With the increasing demand for data-driven decision-making, this degree path is becoming increasingly popular and is a great way to gain the skills needed to excel in the field of data tracking.
2. Bachelor of Science in Information Technology: This degree path focuses on the application of technology to solve business problems. It covers topics such as database management, network security, and web development. With the increasing demand for data-driven decision-making, this degree path is becoming increasingly popular and is a great way to gain the skills needed to excel in the field of data tracking.
3. Master of Science in Data Science: This degree path focuses on the application of data science to solve business problems. It covers topics such as machine learning, data mining, and predictive analytics. With the increasing demand for data-driven decision-making, this degree path is becoming increasingly popular and is a great way to gain the skills needed to excel in the field of data tracking.
4. Master of Science in Business Analytics: This degree path focuses on the application of analytics to solve business problems. It covers topics such as data visualization, predictive analytics, and optimization. With the increasing demand for data-driven decision-making, this degree path is becoming increasingly popular and is a great way to gain the skills needed to excel in the field of data tracking.
Course Provider